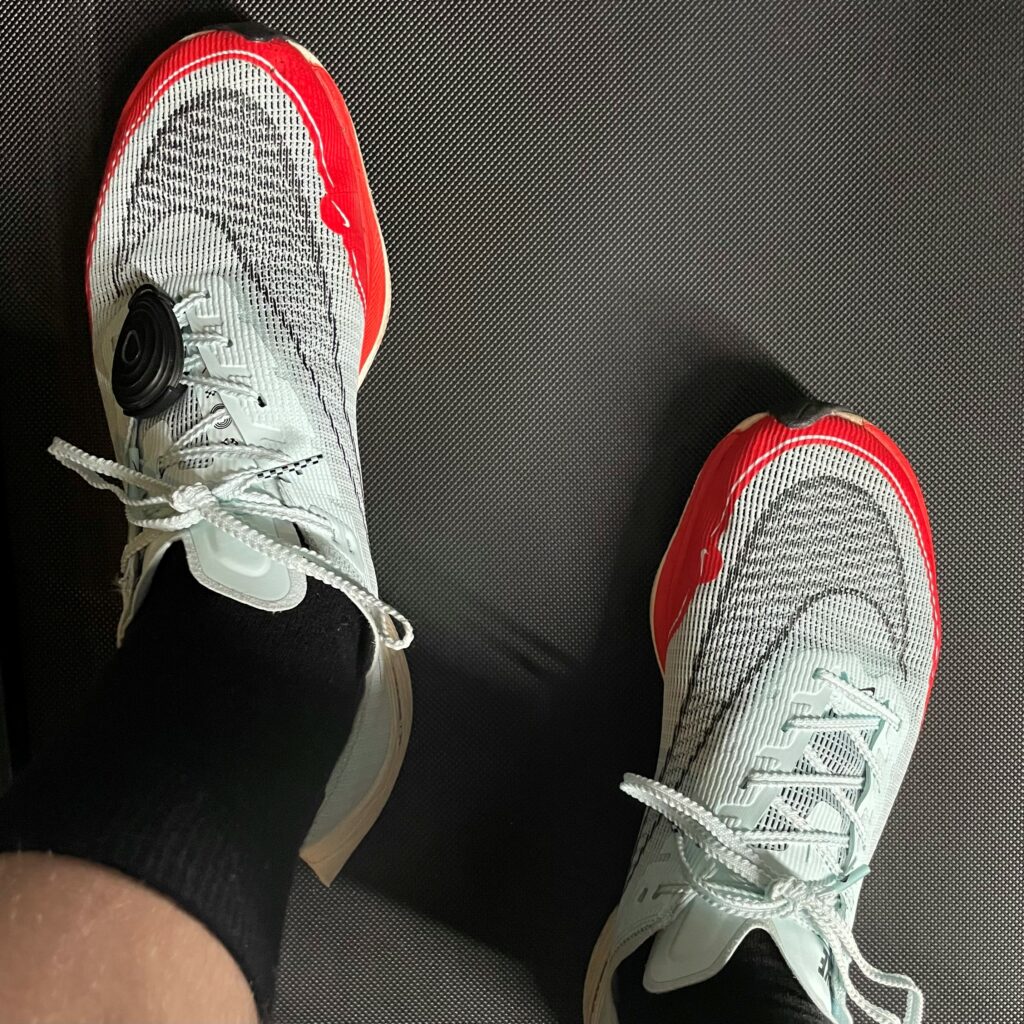
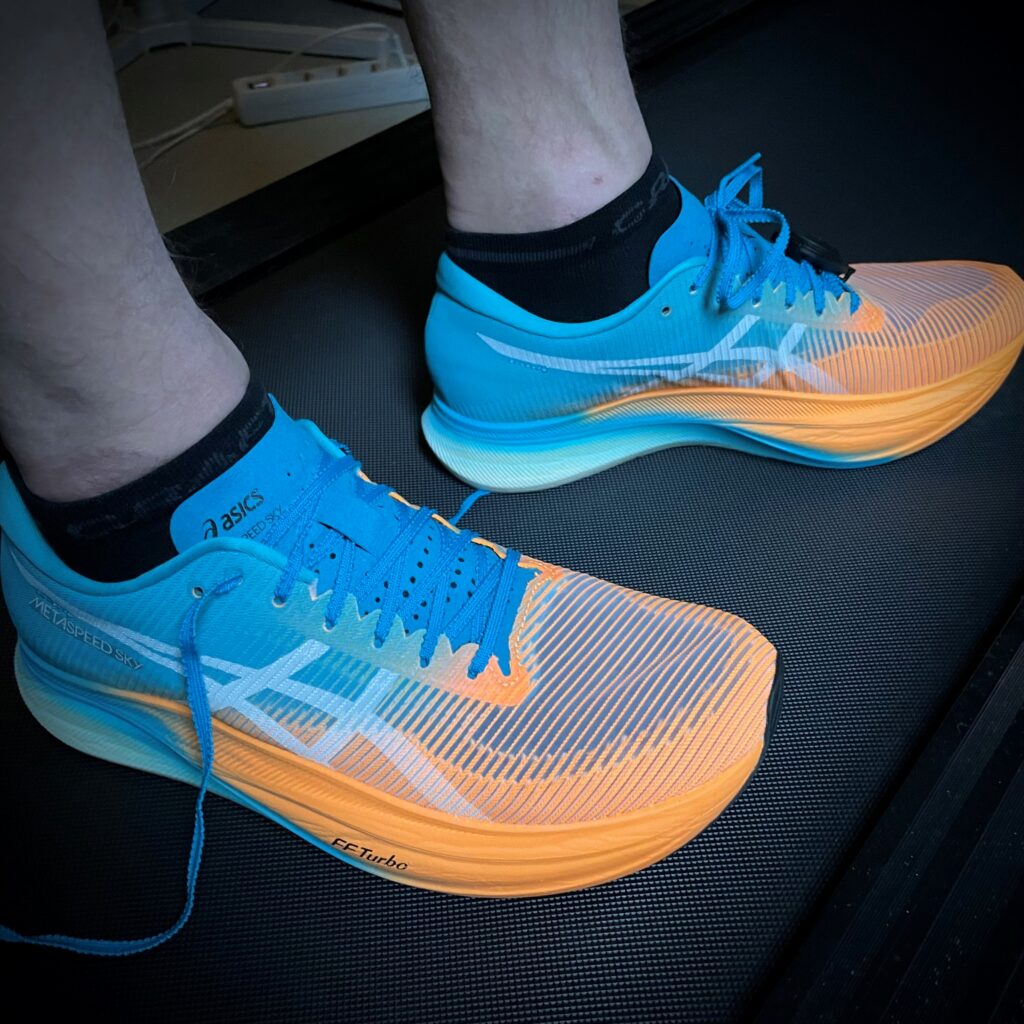
I recently got my hands on a pair of Metaspeed Sky+ from Asics. These shoes have gotten rave reviews from runners everywhere. Now, I wanted to see how they stack up against the best of the best. Are they a potential race day option, or merely a go-to for my long run and workout days? With this Asics Metaspeed Sky+ vs Nike Vaporfly Next% 2 shoe comparison test, I aim to find an answer to just that.
For me, the Vaporfly still rules the roost. The current iteration, branded as the Vaporfly Next% 2, has gotten a mixed reception. While the ZoomX foam has undoubtedly become firmer than in previous versions, and the upper is not the best. But despite all of this, no other shoe that I’ve tried has managed to overthrow it.
The Vaporfly is my first pick on race day, and it is still the benchmark for when I try out new racing shoes. As such, it is only natural that the Metaspeed Sky+ have to be tested against the Vaporfly Next% 2.
All gear is reviewed independently. When you purchase something through links in this article, Run161 may earn a commission. Learn more ›
Test Procedure
Not intended to be a scientific experiment–far from it–my approach to testing the shoes is simple enough. I do a session of longer threshold repetitions, alternating between the two pairs of shoes for each rep.
Afterwards, I compare the data captured for each rep to see if there are any meaningful differences. Additionally, I comment on the data based on my subjective experience, before wrapping it all based on data and personal experience.
Workout Structure
For this particular test, I simply went with my planned workout for the day. That was five times eight minutes at around threshold effort. To make the data more meaningful, I made a slight adjustment to the execution.
While I would normally run this progressing the pace for each rep, I now did the first rep fairly easy, before keeping the pace constant for the last four reps. That gives the data captured during the last four reps more comparative value.
What’s more, I also did the workout on my treadmill. Seeing as the local track is still covered in snow and ice. That brings up some potential pitfalls with regards to the data quality, which I cover in more detail as I examine the data.
Shoe Specifications
| Asics Metaspeed Sky+ | Nike Vaporfly Next% 2 | |
| Weight | 205 gr. | 196 gr. |
| Hell-to-toe drop | 5 mm. | 8 mm. |
| Forefoot stack height | 34 mm. | 31 mm. |
| Heel stack height | 39 mm. | 39 mm. |
| Plate | Carbon fibre | Carbon fibre |
Data
Let’s start by comparing the data. Were there any noticeable differences between the two pairs of shoes? All the data is recorded by a Stryd footpod. The sole exception being heart rate data, for which I use a Garmin HRM Pro.
Pace
| Repetition | Asics Metaspeed Sky+ | Nike Vaporfly Next% 2 |
| 1 | 3:59/km – 6:24/mile | 3:56/km – 6:19/mile |
| 2 | 4:00/km – 6:26/mile | 3:56/km – 6:19/mile |
| Average | 3:59/km – 6:25 mile | 3:56/km – 6:19/mile |
Stryd is way off when estimating pace, and–by extension–distance when running on the treadmill. It sucks. For reference, my treadmill was set to 17.0 km/h (10.5 miles per hour) which equals 3:31 min/km (5:41 min/mile).
What I’ve found, however, is that it is more or less consistently off. That is, if I’m running at a certain speed on the treadmill, the Stryd will fairly consistently indicate a certain corresponding pace. The exception to this is, of course, what the pace data shows here–and the reason why I’ve stopped using the Stryd outside of when running on the treadmill: Each pair of shoes will require a different and unique calibration factor for accurate pace and distance measurement.

It’s interesting to reflect on the potential reasons for why the Stryd believes I’m running slower while wearing the Metaspeed Sky+ than when I’m running at the same speed wearing the Vaporfly Next% 2, however. And I’ll do just that in the following sections.
Power
| Repetition | Asics Metaspeed Sky+ | Nike Vaporfly Next% 2 |
| 1 | 266 W | 270 W |
| 2 | 265 W | 270 W |
| Average | 266 W | 270 W |
Not surprisingly, the power estimates are similarly lower for the Metaspeed Sky+ as with pace. Taken in isolation, the power numbers would seemingly indicate that I’m running more efficiently in the Sky+. That is, they require a lower power output to maintain the same pace.
With the context of the differing pace estimates however, I think it’s safe to conclude that this is an outcome of how the differences in shoe design affect the Stryd’s measurements.
Heart Rate
| Repetition | Asics Metaspeed Sky+ | Nike Vaporfly Next% 2 |
| 1 | 167 (172 max) | 166 (173 max) |
| 2 | 166 (170 max) | 168 (173 max) |
| Average | 166 | 167 |
Completely unaffected by Stryd’s idiosyncrasies, the heart rate numbers offer up some interesting context. As you can see, the average across the two times eight minute reps is actually one beat per minute lower in the Metaspeed Sky+ than the Vaporfly Next% 2.
The absolute difference is obviously negligible. However, the fact that the max and average actually drops in the second rep with the Sky+ is interesting, because that was the fourth and final rep. Generally speaking, you’d expect to see an increase rather than a decrease towards the end of a longer, steady session like this.
At the same time, it’s not an uncommon phenomenon, either, while doing threshold style sessions like this one at a fixed pace. But an interesting fact to note, nevertheless.
Cadence
| Repetition | Asics Metaspeed Sky+ | Nike Vaporfly Next% 2 |
| 1 | 188 spm | 189 spm |
| 2 | 190 spm | 190 spm |
| Average | 189 spm | 190 spm |
These numbers surprised me. Running in the Vaporfly feels snappier, and as if I’m moving with a higher turnover. But, as you can see, the numbers are consistent across both pairs of shoes. My perception is probably thrown off by the fact that it feels like my foot, Achilles and lower calves are working harder through the entire roll over in the Sky+.
Vertical Oscillation
| Repetition | Asics Metaspeed Sky+ | Nike Vaporfly Next% 2 |
| 1 | 6.88 cm | 6.85 cm |
| 2 | 6.62 cm | 6.72 cm |
| Average | 6.75 cm | 6.78 cm |
No glaring differences to speak of here. But, interestingly, it seems that I bounce up and down less and less throughout the session.
Ground Contact Time
| Repetition | Asics Metaspeed Sky+ | Nike Vaporfly Next% 2 |
| 1 | 198 ms | 194 ms |
| 2 | 200 ms | 195 ms |
| Average | 199 ms | 195 ms |
And here we have the explanation for why the Stryd believes I’m running faster in the Vaporfly than the Sky+. According to the numbers, I’m spending more time on the ground in the latter shoe. On average, four thousandths of a second every single step. With a cadence of 190, that will amount to about three quarters of a second per minute.
Now, if you ask the good folks at Stryd to explain this, they will probably talk about how my gait in the Metaspeed Sky+ will cause the treadmill belt to halt every so slightly more with every step. And then, subsequently speed up immediately afterwards to make sure the total number of revolutions of the belt matches the set speed.

I’ve previously brushed off such explanations as excuses. But this was a bit of an eye opener for me. Because these numbers do match my perception that I am, in fact, slower and more cumbersome in the Metaspeed Sky+. I noted above that I was surprised that the cadence numbers were identical. Well, it could very well be that the Vaporfly Next% 2 feels snappier not because of a higher turnover, but instead less ground contact time with each step.
Of course, there’s no way to confirm or debunk this theory while running on a treadmill. And that’s why I’ll be conducting future shoe tests like this one on the track. As soon as the snow and ice clears, that is.
Stride Length
| Repetition | Asics Metaspeed Sky+ | Nike Vaporfly Next% 2 |
| 1 | 1.33 m | 1.33 m |
| 2 | 1.31 m | 1.32 m |
| Average | 1.32 m | 1.32 m |
Not much to note about stride length. As cadence increases ever so slightly and vertical oscillation goes down, stride length seems to decrease a bit throughout the session. But the numbers are more or less identical across the two shoe pairs.
Subjective Perception
As I’ve hinted at while looking at the data, the Metaspeed Sky+ doesn’t quite live up to the hype for me. Perhaps because of the somewhat lower heel-to-toe drop–or just the differing geometry of the shoe, and the rocker in particular–but I feel like my foot and lower leg is working significantly harder from when the shoe hits the ground, to when I toe off.
Although the measured differences are minor, if you squint close enough you can perhaps make out that the data supports this experience. But that’s probably confirmation bias, coming from the way I perceive running in the shoe, more than anything else.
It’s important to mention that the Sky+ is–as previously mentioned–a favourite for many runners. Several I’ve talked to experience it as bouncier and more supportive than the Vaporfly Next% 2. That goes to show just how much personal preference can matter here. When it comes to running shoes, there’s literally no one size that fits all.
All of that said, the conclusion of this test is that I won’t be reaching for the Metaspeed Sky+ the next time I’m lacing up for a race.
Try For Yourself?
You can purchase the tested shoes from Amazon:
Like this?
Let me know by sending me an email at lc@run161.com.
