New Year’s Eve is right around the corner, and it is time for introspection. Now, just before the counter resets to zero, is the moment to take a close look at the cold numbers and hard facts. The training we put in over a full year is the body of work that lays the foundation for how we perform in races through the year, and in the future. But, even more importantly, it represents the platform upon we build our future training, and in turn, future performances.
2018 has been an eventful year in terms of running for me personally, and I am happy with the effort I have put in, and the results I have been rewarded with. Standing at the precipice of a new year, I believe I am in a great position to accomplish my goals for the coming year. But that is a topic for next week. Here, I will take a look at the numbers that represent my training in 2018.
Total Distance Run
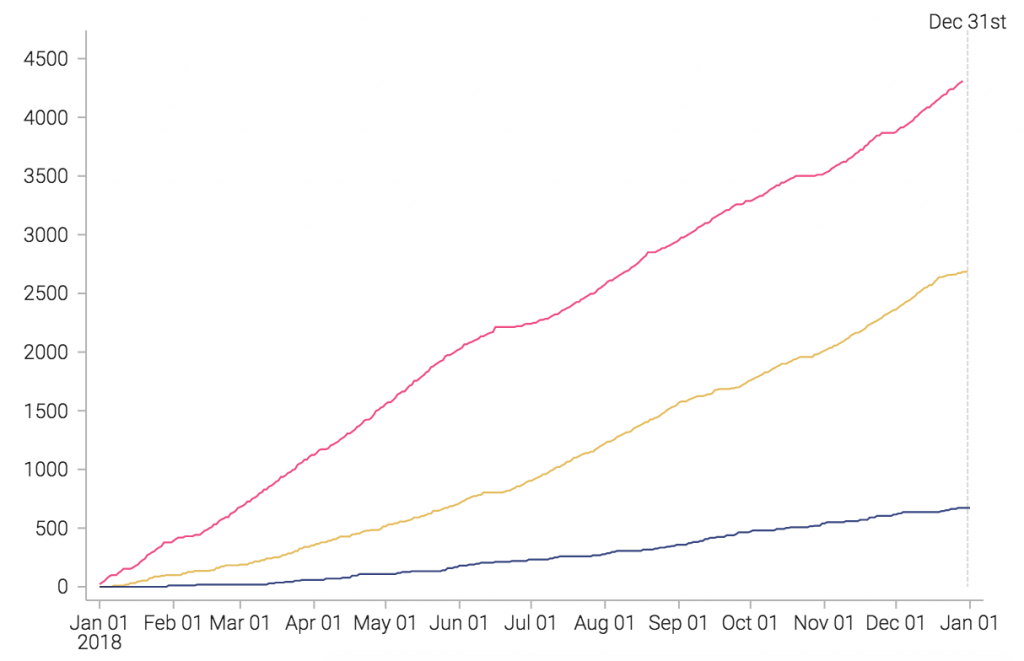
My total distance covered for the year is 4350 kilometres (2709 miles) which amounts to 125% of my goal for the year of 3500 kilometres. The chart above shows how the yearly total compares to 2017 (yellow) and 2016 (dark blue) and, as you can see, the progression is significant. I am up a cool 1676 kilometres (1041 miles) from 2017, which is an increase of no less than 62%.
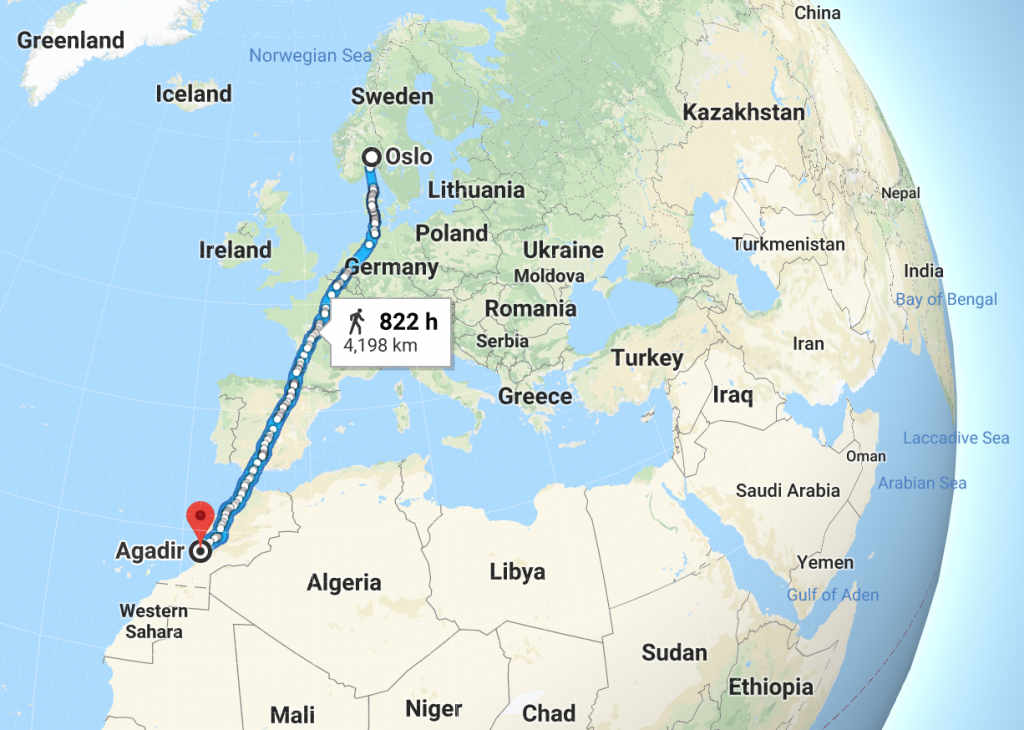
But just how far would 4360 kilometres get me? If I started from Oslo at the beginning of the year, I would have run straight across mainland Europe, and ended up somewhere in Africa at the end of the year. If I follow the west coast, I would have gotten just past the Moroccan city of Agadir. Not too shabby!
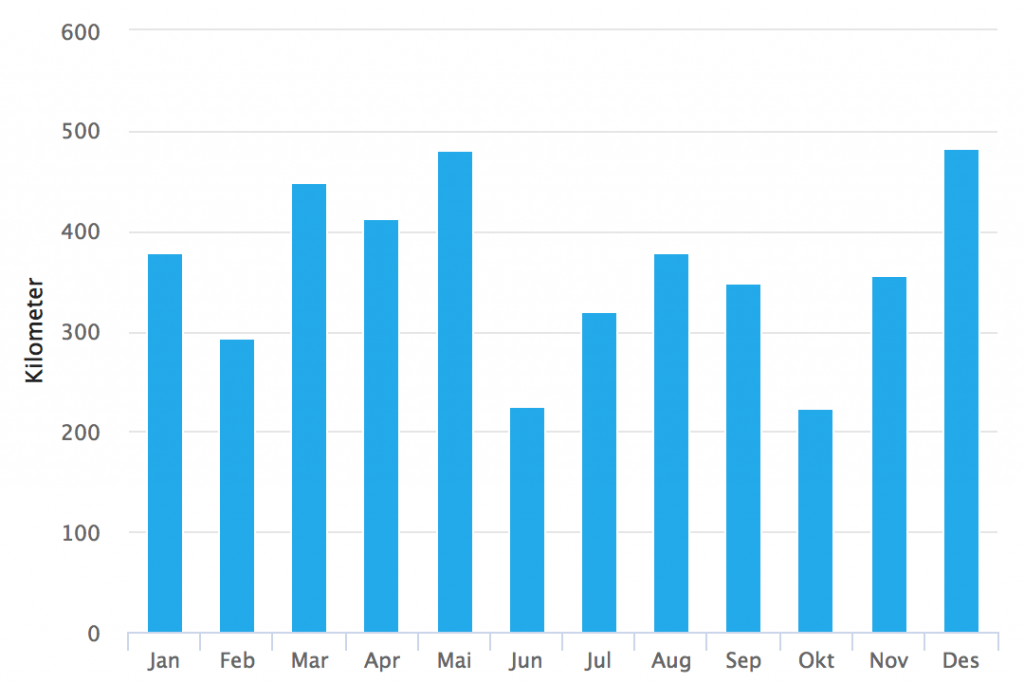
Breaking the total distance down per month, December followed by May are the months with the most distance covered. This is not surprising, considering I was deep into marathon training in May, and I am currently increasing mileage for a new marathon cycle with even higher mileage.
Elevation Gain While Running
I frequently lament the lack of flat stretches of road around where I live, so you would expect the total elevation gain for the year to be significant. Let’s take a look at the chart to find out if it is.
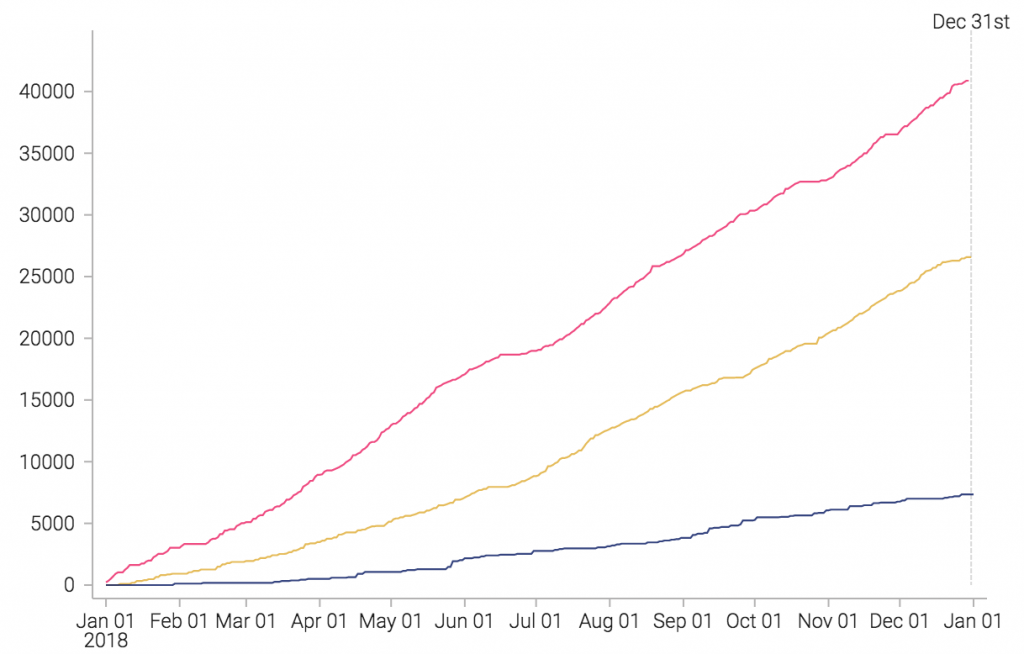
The total elevation gain of 40 876 meters is the equivalent of scaling Mount Everest from sea level to summit more than four and a half times! I’ll take it. But I would still like a flat stretch of road nearby. Compared to 2017, that’s an increase of 14 303 meters (46 925 feet) or 54%.
Time Spent Running
Another interesting stat to look at is time spent running, and see how that stacks up to previous years compared to distance and elevation gain.
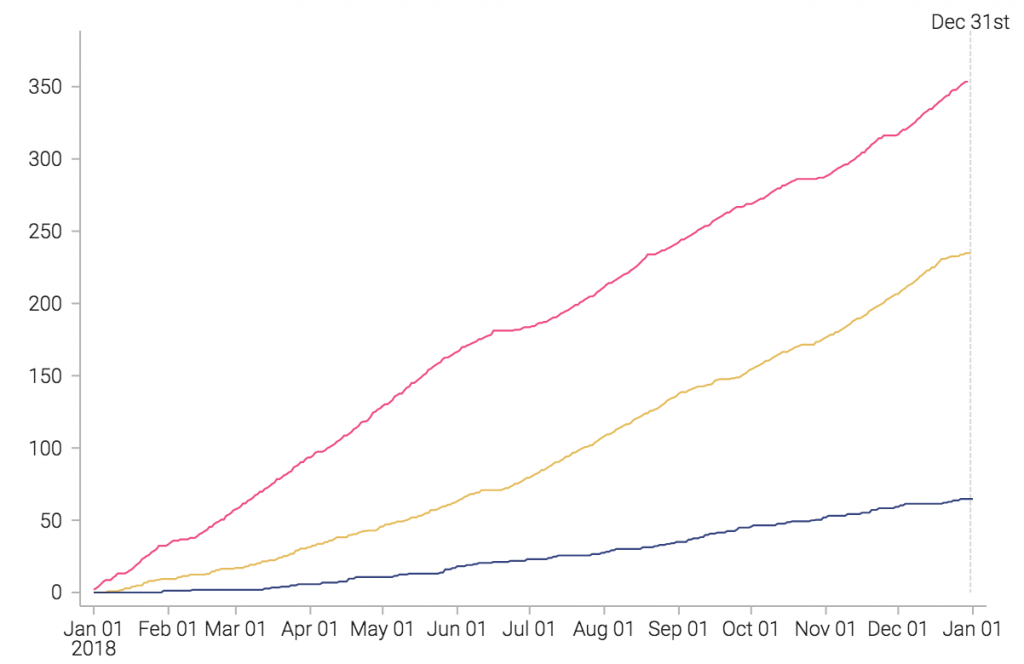
Throughout the year I spent 353 hours and 25 minutes of running, which represents an increase of 51% from the 234 hours in 2017. Assuming eight hours of sleep every night, this means that I spent around 6% of my waking hours in 2018 running. Now that’s what I call time well spent!
As my time spent running increased less than distance, relatively speaking, a quick mental calculation reveals that I did, on average, run faster in 2018 than I did in 2017. The hard facts are that my average pace across all my running in 2017 was 5:15 min/km (8:27 min/mile) while that increased to 4:52 min/km (7:50 min/mile). Quite encouraging, given that I still place a lot of emphasis on running my easy runs easy.
One factor, apart from increased fitness, that explains the increase in average pace, is that I ran fewer uphills on average in 2018 compared to 2017. The average climb per kilometre was 9.9 meters in 2017, decreasing to 9.2 in 2018.
That was my running year in numbers! I hope you had a great year as well, and regardless, that you feel ready to go at it again in a few hours when the new year brings a clean slate.
Want more details from my 2018 year in running? Check out these race reports from the races I ran this year:
- Fredrikstadløpet Half Marathon
- Sentrumsløpet 10k
- Oppegårdmila 10k
- Midnight Sun Marathon
- Hytteplantesten 5k
- Skiløpet 5k
- Skagerakløpet Half Marathon
If you want to keep up with my training, you can follow me on Strava.
Like this?
Let me know by sending me an email at lc@run161.com.
